Flash floods frequently occur in Karonga, a district in Northern Malawi, and have a considerable impact on households. This research aimed to combine different types of data (drone, street view imagery, and survey data) to map the flood vulnerability of these households. To get a complete overview of the vulnerability situation, my/our research included data on both social vulnerability (e.g. poverty) and physical vulnerability (e.g. housing quality).
Parties involved
I completed this thesis as part of my MSc in Geographic Information Management and Application. Marc van den Homberg, scientific lead at 510, and Maarten van Aalst, director at Red Cross Red Crescent Climate Center and professor at Twente University, supervised the research. The Malawi Red Cross Society (MRCS) acquired the drone and survey data. Moreover, Jacopo Margutti, data scientist at 510, and Christopher Beddow, Solutions Engineer at Mapillary, were involved in developing a model that automatically detects and locates wall material from street view imagery.
Importance of this research
The Karonga district in Malawi is prone to flash- and riverine floods, affecting thousands of people yearly. A large part of the Malawians lives in houses that are susceptible to floods. This makes the population increasingly vulnerable as their houses do not meet the required safety standards. In addition, the social status of households largely determines their vulnerability and resiliency to floods.
The risk and impact of natural disasters are constantly increasing due to climate change. Humanitarian actors are anticipating by implementing data-driven tools (FbF & early warning systems) to initiate early action (and hence to shift humanitarian aid after the disaster to early action before). This research builds upon these developments by aiming to improve data on household vulnerability.
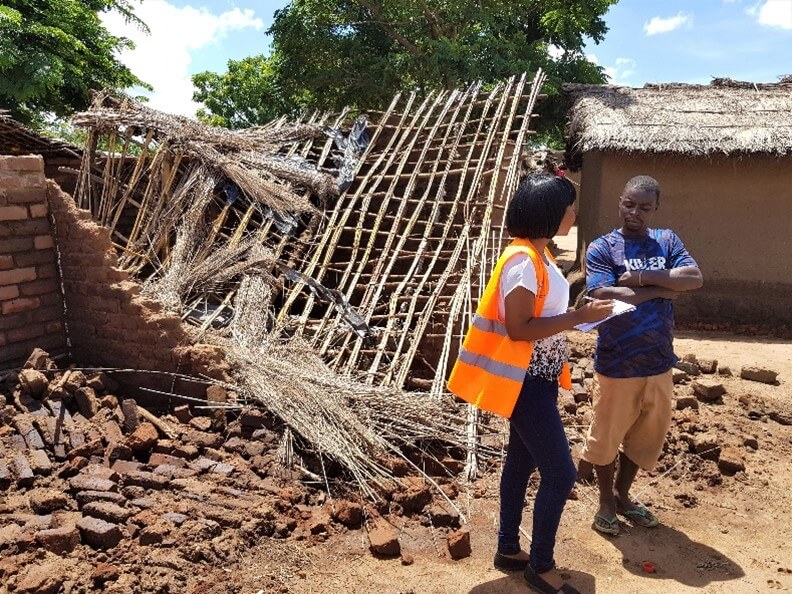
Malawi Red Cross volunteers visit flood-hit communities to assess the damage following heavy rain.
Main findings
To identify the most vulnerable areas to floods, highly detailed information on the household level is required. However, this information is often unavailable or inaccessible in Malawi. To overcome this problem, this research uses an alternative approach to data collection. Drone images were used to identify building characteristics from above, such as rooftop material and building size. Images of Mapillary, an open-source alternative to Google Streetview, were used to recognise the wall material of the buildings. By combining these datasets for the same buildings, characteristics from multiple perspectives can be identified. Household survey data was used to enrich the physical vulnerability data with social attributes such as education, health, and income. Consequently, the most vulnerable households could be targeted based on either or both physical and social criteria. This information is crucial for humanitarians in prioritising the most critical areas for the distribution of aid. Moreover, it can facilitate policymakers to define priority areas for structural risk reduction measures, such as building strengthening and education programmes. To conclude, this research shows that by combining datasets, a much more valuable outcome can be reached compared to using the datasets separately.
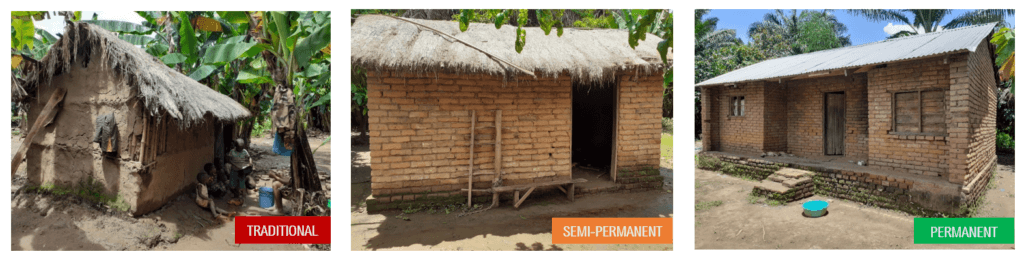 Households in Northern Malawi identified as traditional, semi permanent and permanent.
Next steps
I will present my work at the EGU General Assembly 2021. The work at 510 really inspired me to continue my career in the humanitarian sector. Recently, I started as a GIS and remote sensing intern at IMPACT initiatives and REACH. During this internship, I will focus on the application of automated damage assessment in the humanitarian sector and also link this to the work of 510 on ADA.
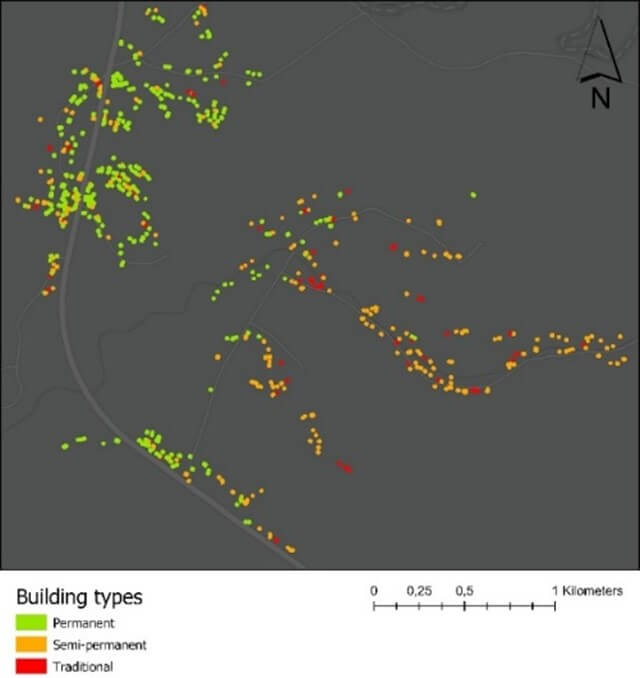
Map showing the physical vulnerability of households in Karonga, Malawi
Image sources:
IFRC ShaRED Web Platform
Malawi Red Cross